Measuring sound with Vernier microphone

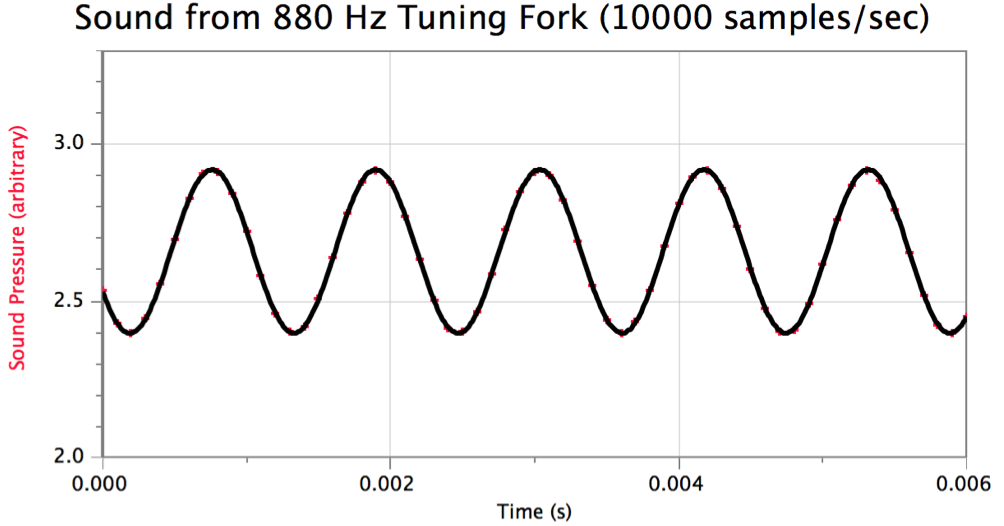
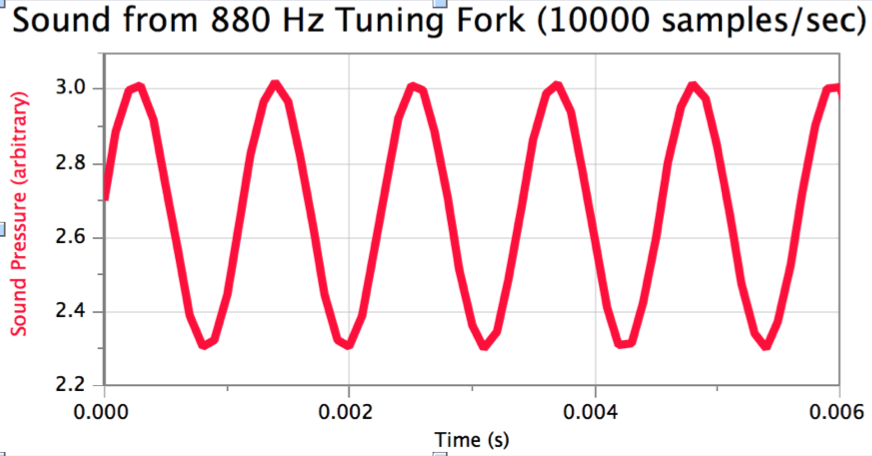
When using the Vernier microphone to measure sound waves, the result is not always a nice-looking sine curve in Logger Pro.  For example, the graph of the sound wave produced by a 880 Hz tuning fork when data is collected at 10000 samples/second is shown below. This almost looks like a smooth sine curve, but has some sharp edges at the troughs and peaks. Is it possible to get better results?

Screen Shot 2015-06-08 at 3.28.24 AM

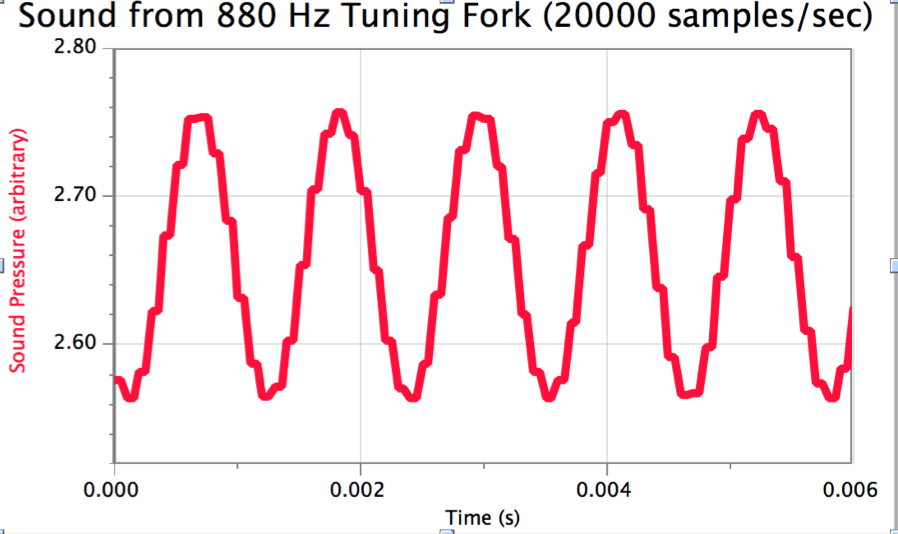
Will increasing the sampling rate improve the results?  Surprisingly, if the sampling rate is increased, every data point is doubled, producing a graph that appears to have steps in it. Below is the graph of the sound wave produced by the same tuning fork, but with the data collection rate set to 20000 samples/second. According to the data table in Logger Pro, pairs of identical pressure values occur 0.00005 seconds apart.

Screen Shot 2015-06-08 at 3.23.00 AM

How can students measure these sound waves and get results that more accurately reflect the nature of the sound wave?

Tip #1: Do not use a sampling rate higher than 10000. Keeping the sampling rate at 10,000 prevents the strange doubling of data points, which is the cause of the steps in the graph.

Tip #2: Remove the lines connecting the data points;  fit a sine curve to the data. Thanks to Vernier support for this suggestion! 

The steps to accomplish this are:

1. Removing the connecting lines: Select the graph, then go to the Graph menu, and select Graph Options. Choose the Graph Options tab, and then de-select “Connect Points,” and click OK. The result at this point should look something like this:

Screen Shot 2015-06-08 at 3.40.35 AM

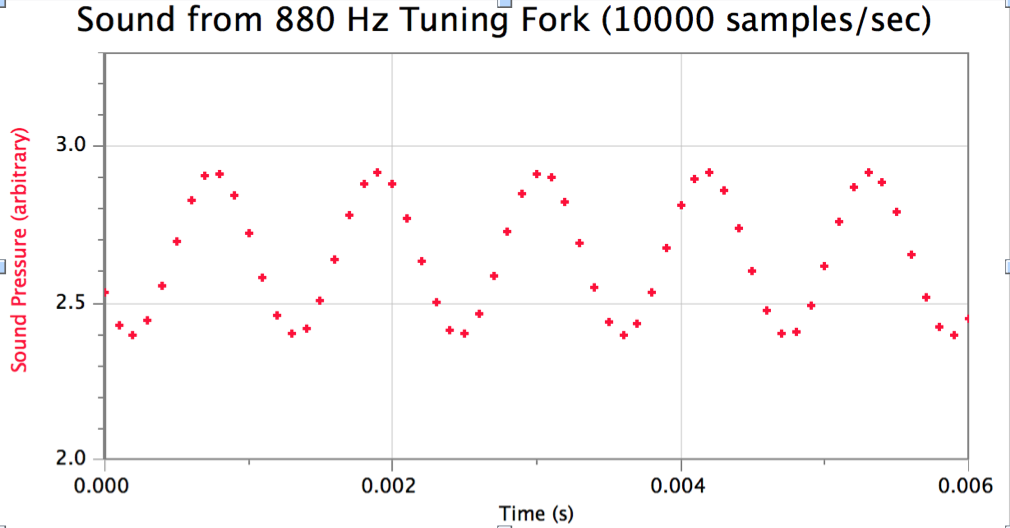
Note: Initially, when you remove the connecting lines, the graph may appear to be a chaotic jumble of data points with no apparent pattern, but by changing the time-axis to a short enough time interval, you will once again be able to see the sine-wave shape of the individual data points.

2. Fitting a sine curve to the data: Click on the “curve fit” button, and select the Sine function. Click “Try Fit” and “OK.” The graph should now look like this:

Screen Shot 2015-06-08 at 3.42.23 AM


How to Destroy an Arduino

As I begin to have students work with Arduino circuit boards, it seemed prudent to review the ways these circuit boards can be damaged. I found the article “10 Ways to Destroy an Arduino” by Ruggeduino to be very helpful, as it explains what kinds of connections will damage an Arduino and explains why, complete with circuit diagrams that show the path which current will take.

Could electric eels power a house?

A Portland General Electric customer asked the company this question, and the company decided to explore the possibility. What do you think? What would be needed to make this possible?

Watch this 2-minute video as PGE’s director of Technology Strategy, Dr Conrad Eustis, explains his findings.

Bicolor LEDs

Do all red-green bicolor LEDs have the same internal connections?

In preparation for designing an emergency flashlight this week, my students investigated the direction that charge can flow through various kinds of diodes: an LED that emits white light, a Bicolor LED that emits red or green light depending on the direction that charge travels through it, and a rectifier diode.

Last year for this investigation, we used the Radio Shack Bicolor Red and Green LED (Model# 276-0012), but this year I needed to replenish my supply and found that Radio Shack no longer carries this part. At Oregon Electronics, I found bicolor LEDs and assumed they would have the same internal connections. Wow, was I wrong! Not a big deal now that I know what’s going on, but my erroneous assumption caused me a great amount of confusion and wasted time because I was using the color of the light emitted to deduce the direction of charge flow in an electromagnetic induction application.

The internal connections for two different bicolor LEDs
Inside of a bicolor LED, there are two different-colored LEDs connected in parallel but with opposite polarity.

  • When charge flows (conventional current) from the long lead to the short lead of the Radio Shack LED, it will emit GREEN light.
  • When charge flows from the long lead to the short lead of the Oregon Electronics bicolor LED, it will emit RED light.  What a surprise!

IMG_2007

Lesson learned: Internal connections of bicolor LEDs are not standardized. Always test new bicolor LEDs to discern the internal connections.

Jello Fiber Optic Cable

A fiber optic cable must have a core that is more optically-dense than the layer surrounding the core (the cladding.)  If the light is traveling inside the core and hits the boundary between the core and the cladding, it can completely reflect from that boundary instead of passing through the boundary and out into the cladding.  When this happens, the light will bounce back and forth inside the core, even traveling around curves! This process is called “total internal reflection.”

IMG_1682 Total internal reflection can be observed by making a “fiber optic cable” out of Jello. Jello is more optically dense than air, so the Jello will be the core, and the air surrounding the Jello will be the cladding. By aiming a laser pointer into the end of the Jello fiber optic cable, you can find some angles of incoming light that will produce total internal reflection. (It helps to do this in a darkened room.)

IMG_1685

Although a strong beam can only be seen for a few reflections, the fact that the end of the “cable” is so bright indicates that most of the light has stayed inside the cable, traveling all the way to the end by total internal reflection.


Recipe for making a Jello Fiber Optic Cable

IMG_1687

Ingredients

  • 2 small packets unflavored Gelatin
  • 4.5 ounces Lemon Jello (from a 6 oz box)
  • 2 cups boiling water

Directions

Mix all ingredients together until powders are completely dissolved. Pour into a 9×13 Pyrex dish and refrigerate until firm.  Cut into strips, about 1 cm wide, avoiding areas where the Jello is curved due to the shape of the Pyrex dish.


Fluorescent Minerals!

Certain materials will emit visible light a short time after absorbing ultraviolet light. This process is called fluorescence.  Ultraviolet light has a shorter wavelength than visible light, and our eyes are not capable of seeing ultraviolet light. We can see the emitted light because it has a longer wavelength and is in the part of the spectrum that our eyes can detect.

Our family recently visited the Rice Northwest Museum of Rocks and Minerals in Hillsboro, Oregon, and I was fascinated with their display of fluorescent minerals!  It is really a sight to see. Had I known what treasures filled this museum, I would have visited years ago. (You can even save on admission by picking up a Cultural Pass at the library.)

IMG_0134

Minerals in normal lighting

IMG_0133

Minerals emitting visible light after absorbing ultraviolet light


The lighting on the minerals automatically alternates between normal room lighting, long wave ultraviolet light, and short wave ultraviolet light, so it is easy to compare the appearance of the minerals in each type of light.

This excellent photo showing a variety of colors being emitted is from Wikipedia.

Fluorescent_minerals_hg


Circuit Simulations

There’s nothing like the real thing when it comes to circuits… actually connecting the wires, battery, lightbulbs, and meters yourself! But interactive simulations have their place too. PhET at hte University of Colorado Boulder has produced outstanding simulations on many topics in the various sciences, and enhance one’s study of circuits I would highly recommend their “Circuit Construction Kit” below. Many different circuits can be constructed by dragging wires, batteries, and lightbulbs, and meters can be used to measure voltage and current. The user can change the resistance of the lightbulbs and wires, and the voltage of the batteries.

Circuit Construction Kit (DC Only)

Click to Run

Apps that Utilize Physics Reasoning

An article by Mind/Shift recommends 5 apps that utilize reasoning with physics concepts, even if it is not obvious to the player. Angry Birds is a popular game in this category, as the player sends projectile flying with different speeds and angles depending on the how the slingshot is aimed, how far back it is stretched, and the different masses of the birds.

The 5 apps recommended by Mind/Shift are:

1. Crayon Physics Deluxe

2. World of Goo

3. Coaster Crafter

4. Amazing Alex

5. Tinkerbox

Writing interactive stories with Twine

I recently discovered an easy-to-use application, Twine, that enables the user to write interactive stories along the lines of the “Choose your Own Adventure” books. The output is saved in in HTML format, making it ready to post on a web page. I would recommend this tutorial to help you get started. Check out the story below for an example written by a 5th grade student. Twine is a very cool tool that can be used to express creativity in any subject including physics!

Sample Story: Backtrack

Portland Mini Maker-Faire

I missed it last year, but I am determined not to miss it again!  I am marking my calendar for Portland’s second Mini-Maker Faire on Sept 14 and 15, 2013 at OMSI. The OMSI brochure reads, “The greatest show (and tell) on Earth – a family-friendly showcase of invention, creativity and resourcefulness. A weekend filled with an incredible variety of exhibits, talks, demonstrations, and performances. It’s the perfect marriage of arts, crafts, science, and engineering.”

Come see what people are making and be inspired!